In the fast-paced world of project management, solving a problem requires more than a quick fix; it demands a deep dive into the underlying issues. Throughout this guide, terra will be your companion, helping you navigate the complexities of root cause analysis with a fishbone diagram and showing you how to turn insights into action.
What is a fishbone diagram?
To effectively solve any organizational hurdle, one must first understand the fundamental tools of quality management. The fishbone diagram stands as one of the most reliable frameworks for this purpose.
Definition of a fishbone diagram
A fishbone diagram is one of the most widely used tools in quality management and is considered one of the Seven basic quality tools.
Also known as a cause and effect diagram or an Ishikawa diagram (after its creator, Kaoru Ishikawa), the fishbone diagram can help users identify the many possible causes for a problem by sorting ideas into useful categories and is especially useful in structuring brainstorming sessions. It is called a fishbone diagram because when completed, the chart is shaped like a fish skeleton.
The fishbone diagram has variations with nuanced procedures and outcomes, including:
- Cause enumeration diagram.
- Process fishbone.
- Cause and effect diagram with the addition of cards (CEDAC).
- Desired-result fishbone.
- Reverse fishbone diagram.
In smaller projects or when immediate action is needed, the fishbone diagram may be the only tool used to determine the root cause(s) of a problem and guide actions. For complex problems, however, it may be one of several tools used in the improvement process alongside others like a responsibility matrix or an action-planning matrix.
Purpose of using a fishbone diagram
The primary purpose is to facilitate Root Cause Analysis (RCA). By using a fishbone diagram template, organizations can:
- Identify bottlenecks in complex processes.
- Encourage cross-functional brainstorming.
- Prevent “solution-jumping” where teams treat symptoms instead of causes.
- Analyze interconnected factors like Leadership Style or operational constraints that affect output.

Benefits of using a fishbone diagram
Before diving into the “how-to,” it is essential to understand the value this tool brings to a business environment. It is not just a drawing, it is a strategic asset for decision-makers.

Benefits for identifying root causes
The diagram provides a holistic view of the “ecosystem” surrounding a problem. It allows teams to see how different categories, such as equipment and people-interact. This clarity is crucial when dealing with complex issues where the root cause is hidden behind multiple layers of operational data.
Benefits for problem-solving and decision-making
- Visual structure: It turns chaotic brainstorming sessions into an organized map.
- Team alignment: It ensures everyone is looking at the same “big picture,” from frontline staff to executive leadership.
- Resource allocation: By identifying the most likely causes, managers can allocate budgets and manpower more effectively to fix what is actually broken.
Core elements of a fishbone diagram
The diagram is built around a central axis, resembling a fish skeleton, which helps keep the analysis focused.

Central spine and problem statement
The “head” of the fish contains the Problem Statement, a specific description of the issue. The “spine” is a horizontal line leading to the head, acting as the main anchor for all potential causes.
Primary cause categories (major bones)
These are the large branches off the spine. Common categories include Manpower, Methods, and Machines. Choosing the right categories is the most critical step in creating a functional fishbone diagram example.
Secondary causes (sub-bones)
Each major bone can have sub-branches. These are specific factors that contribute to the main category. For instance, under “Manpower,” a sub-bone might be “High turnover due to a rigid labor contract.
Additional cause layers and limitations
For very complex problems, you can add tertiary bones. However, teams should be wary of over-complicating the visual, as the goal is to find actionable insights, not to map every minor detail.
Root causes in a fishbone diagram
To make the brainstorming process more efficient, professionals use established models to categorize their “bones.” Depending on your industry, you may choose one of the following frameworks.
Fishbone diagram analysis using the 5M1E model (Manufacturing)
The 5M1E framework is the most traditional and widely used version of the fishbone diagram. By breaking down a factory-floor problem into these six categories, managers can pinpoint exactly where a bottleneck or defect originates.

Material
“Material” covers the raw goods, components, or even the data required to produce the final output. If the quality of the raw material from a supplier varies, the end product will too. Issues here can include contamination, incorrect specifications, or delays in the supply chain. In a digital context, “Material” can also refer to the quality of the information or briefs provided to a team.
Machines
This refers to the tools, software, and equipment used in the process. When a product is defective, you must ask: Is the machine calibrated? Is the software up to date?
Frequent breakdowns might suggest that the maintenance schedule is being ignored, or that the machinery itself is obsolete and unable to handle the current production volume.
Man
This category focuses on the human element. It isn’t just about “who” did the task, but their capability and mindset. Root causes here often include a lack of training, fatigue, or poor communication.
In modern management, the Leadership Style of the supervisor also plays a huge role; an overly authoritative style might prevent workers from reporting small errors before they become big problems. Additionally, if the roles are not clearly defined in the employment contract, it can lead to confusion and accountability gaps.
Method
This looks at the “How” – the rules, workflows, and Standard Operating Procedures (SOPs). Even with great people and machines, a flawed process will yield flawed results. Common root causes include outdated manuals or a labor contract that restricts necessary flexibility in work shifts, leading to gaps in production during handovers. If the “Method” is too complex, employees are more likely to take shortcuts.
Measurement
In manufacturing, you are only as good as your data. This category examines the standards and metrics used to evaluate quality. Is the scale accurate? Are the sensors functioning? If your “Measurement” is inconsistent, you might be throwing away good products or, worse, shipping defective ones because your testing thresholds were set incorrectly.
Environment
The environment refers to the physical conditions of the workspace. This includes temperature, humidity, noise levels, and even lighting. In many manufacturing processes (like electronics or food), a slight change in humidity can ruin a whole batch. Safety is also a key factor here; a chaotic or unsafe environment directly impacts the focus and performance of the staff.
Use of the 5M1E fishbone diagram in specific industries
While born in the automotive industry (specifically at Toyota), the 5M1E model is now a staple in:
- Pharmaceuticals: To ensure chemical consistency and sterile environments.
- Food & Beverage: To track contamination sources and recipe adherence.
- Construction: To manage site safety, equipment maintenance, and material quality.
- Software Development: Adapting “Machines” to servers and “Materials” to code libraries.
The 8 Ps in a fishbone diagram (Used in product marketing)
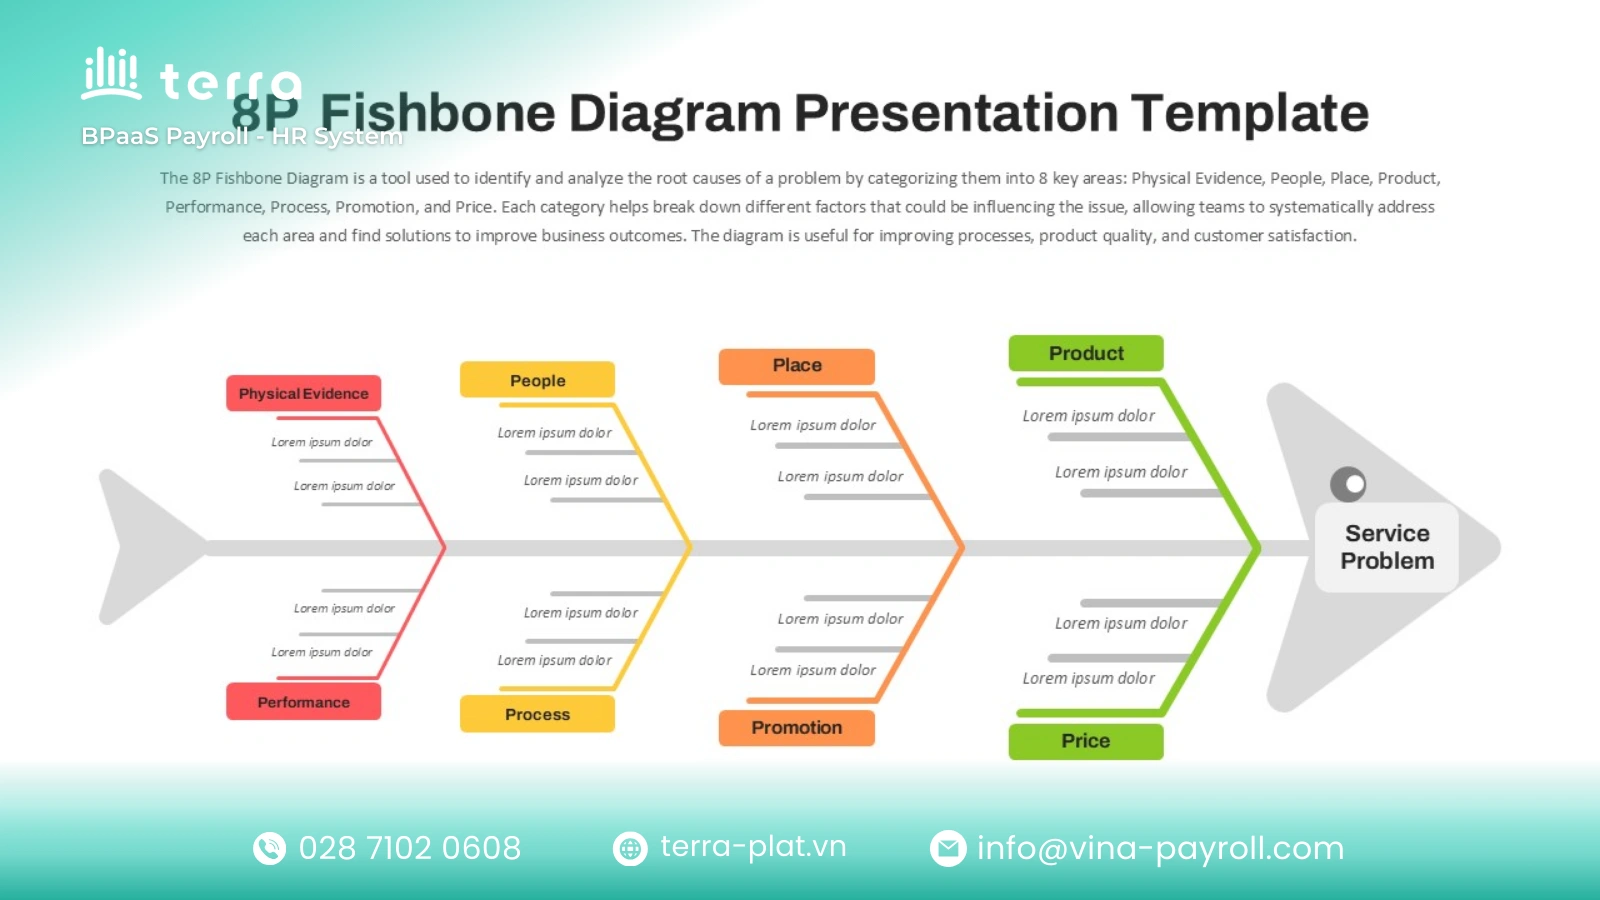
While the 5M1E model focuses on production, the 8 Ps are tailored for marketing, sales, and service-heavy businesses. This model helps identify why a product isn’t selling or why customer satisfaction is dipping.
Product
This category examines the “what.” Is the core offering meeting the market’s needs? Causes might include poor design, a lack of essential features, or a product that doesn’t live up to its marketing promises. You might also look at packaging and branding here.
Price
When price is a root cause, it’s often about value perception. Is the product too expensive for the target demographic? Or is it priced so low that customers perceive it as low quality? Issues with discount structures or hidden fees also fall under this “bone.”
Place
Also known as distribution. If a product is great but customers can’t find it, “Place” is the issue. Root causes could include broken supply chains, poor placement in retail stores, or a digital storefront that is difficult to navigate.
Promotion
This looks at how the message is delivered. Causes for failure here include a misaligned advertising strategy, poor SEO performance, or a brand message that doesn’t resonate with the audience’s current pain points.
People
The human element is often the most complex. In a fishbone diagram example, “People” issues often stem from a rigid or toxic Leadership Style that stifles creativity. It also covers staff training, customer service attitudes, and how employees interact with the brand.
Process
How is the service delivered? “Process” covers the customer journey from the first touchpoint to the final sale. Bottlenecks in the checkout process, slow response times from support teams, or overly bureaucratic refund policies are common root causes.
Physical evidence
In the service industry, customers look for tangible cues of quality. For a restaurant, this is the cleanliness; for a software company, it’s the professional look of the UI. If the “Physical Evidence” is poor, it creates a lack of trust that can kill sales.
Performance
This category measures the outcomes against goals. Root causes under “Performance” might include a lack of Key Performance Indicators (KPIs), poor ROI on marketing spend, or a failure to track customer retention rates effectively.
The 4 or 5 Ss in a fishbone diagram (Used in service industries)
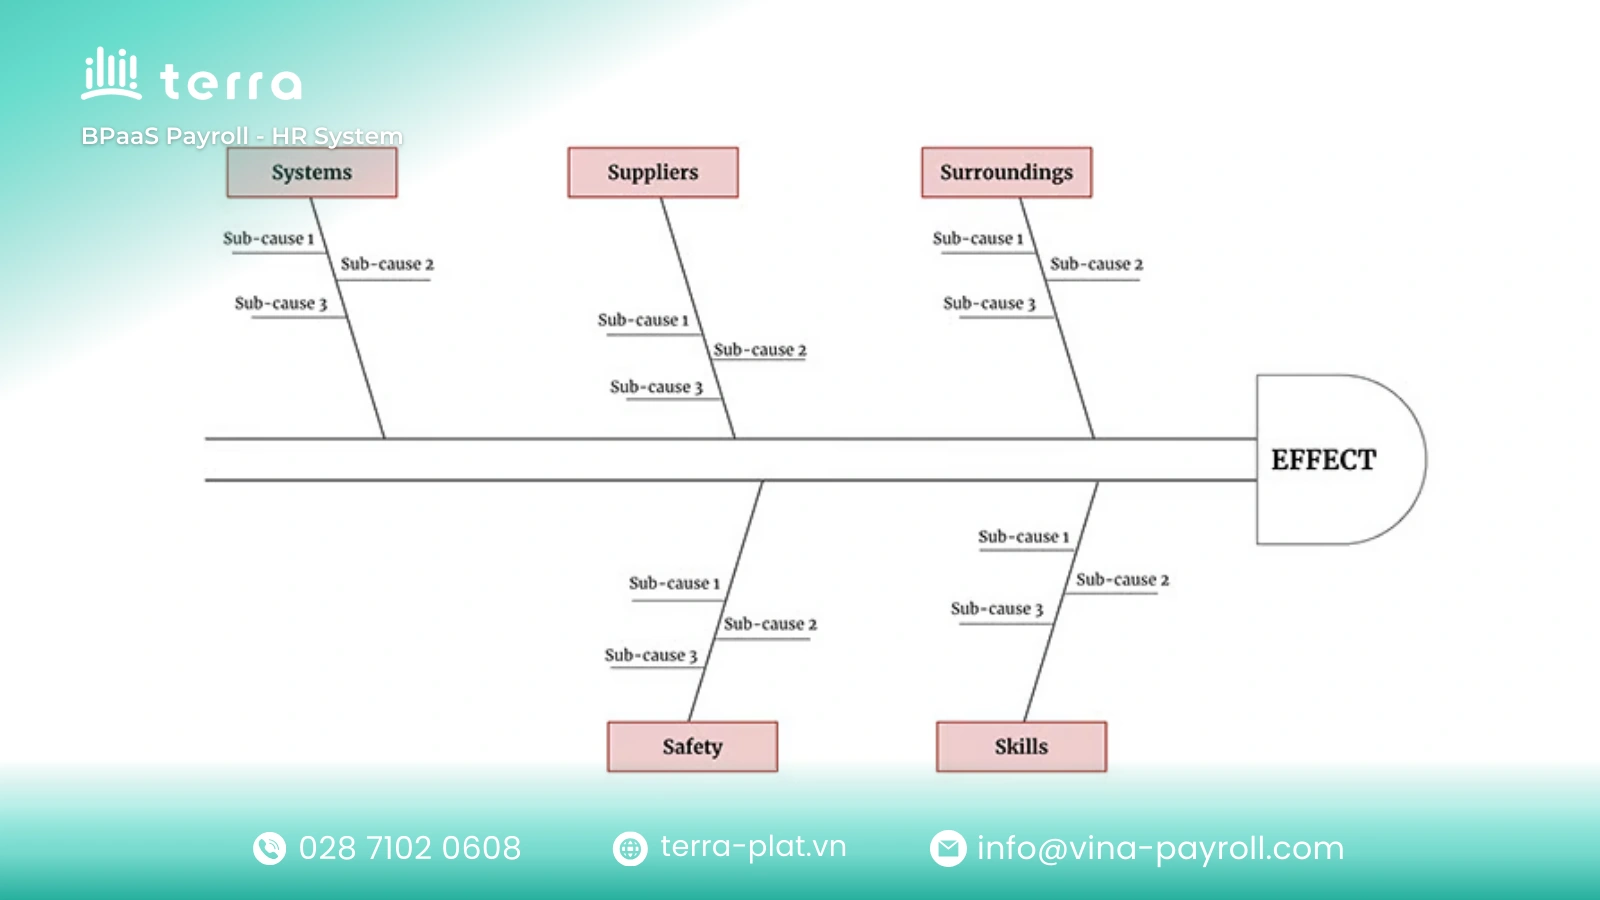
Service industries (like healthcare, retail, or hospitality) don’t have “machines” in the traditional sense. Instead, they use the “S” categories to organize their brainstorming.
Surroundings
This is the equivalent of “Environment.” It refers to the physical or digital space where the service is provided. For example, if a hotel is getting bad reviews, “Surroundings” causes might include loud construction nearby or a lobby that feels outdated and uninviting.
Suppliers
Service businesses rely heavily on third parties. If a restaurant’s food quality drops, the root cause might be a change in a vendor’s delivery schedule. This is also where you analyze the strength of your labor contract with outsourcing agencies or freelance partners.
Systems
This refers to the “backbone” of the operation, usually IT or communication systems. Common issues include outdated software, frequent server downtime, or a lack of a centralized database (like a CRM) which leads to lost customer information.
Skill
Do the employees have the competency to do the job? Unlike “People” (which is about behavior), “Skill” is about technical ability. A root cause here might be a gap in training or an employment contract that doesn’t clearly define the technical requirements needed for the role.
Safety
In industries like finance or healthcare, “Safety” is paramount. Root causes here might include a lack of data encryption, failure to follow hygiene protocols, or workplace hazards that lead to high employee injury rates, which in turn affects service delivery.
How to make a fishbone diagram in manufacturing
Creating a fishbone diagram is more than just a drawing exercise; it is a collaborative process that requires diverse perspectives. By following these four structured steps, your team can move from confusing symptoms to a valid, data-backed conclusion.

Step 1: Define the problem clearly
Before you can analyze what is fishbone diagram methodology, you must define the “Effect” you are trying to solve. Write the problem statement in a box at the front (the head of the fish).
- Be specific: Vague problems lead to vague solutions. Instead of “Low productivity,” use a data-driven statement like “Line 4 experienced a 15% increase in downtime during the night shift.”
- The 5W1H Rule: Ensure your problem statement answers Who, What, Where, When, and to what extent (How much).
Step 2: Identify major influencing factors
Draw a horizontal line (the spine) and several diagonal branches (the major bones). These branches represent categories of potential causes.
- Choosing the right framework: In a manufacturing context, the 5M1E model is the industry standard. However, you can choose a fishbone diagram template based on the 8Ps or 4Ss depending on whether the problem is operational or administrative.
- Visual setup: These categories serve as “buckets” for your brainstorming, ensuring your team looks at the problem from multiple angles—such as technology, people, and the environment.
Step 3: Identify secondary causes
This is the most critical phase of how to make a fishbone diagram. For each major category, brainstorm specific reasons why the problem might be occurring.
- The 5 Whys Technique: For every cause identified, ask “Why?” up to five times.
Example: If “Manpower” is the category and “Human Error” is the cause, ask why the error happened. Perhaps the employment contract for new hires doesn’t include a mandatory 40-hour safety training period, or a rigid Leadership Style has discouraged workers from reporting machine glitches early.
- Depth Matters: Draw these as smaller horizontal lines branching off the main bones to show the relationship between the cause and the effect.
Step 4: Analyze and validate
Once your diagram is “full” of potential causes, your team must distinguish between theories and facts.
- Prioritize: Look for causes that appear in multiple categories or those with the strongest logical link to the problem.
- Data validation: Use real-world evidence to test the causes. For instance, if you suspect an outdated labor contract is causing fatigue-related errors, analyze time-clock data and shift patterns to confirm if overtime is exceeding safe limits.
- Focus on the root: Circle the 2 or 3 most impactful factors. These are the “root causes” where you should focus your corrective actions.
Fishbone diagram example in manufacturing
Seeing the tool in practice can help your team understand its versatility across different business scenarios.
Fishbone diagram example – Simple case
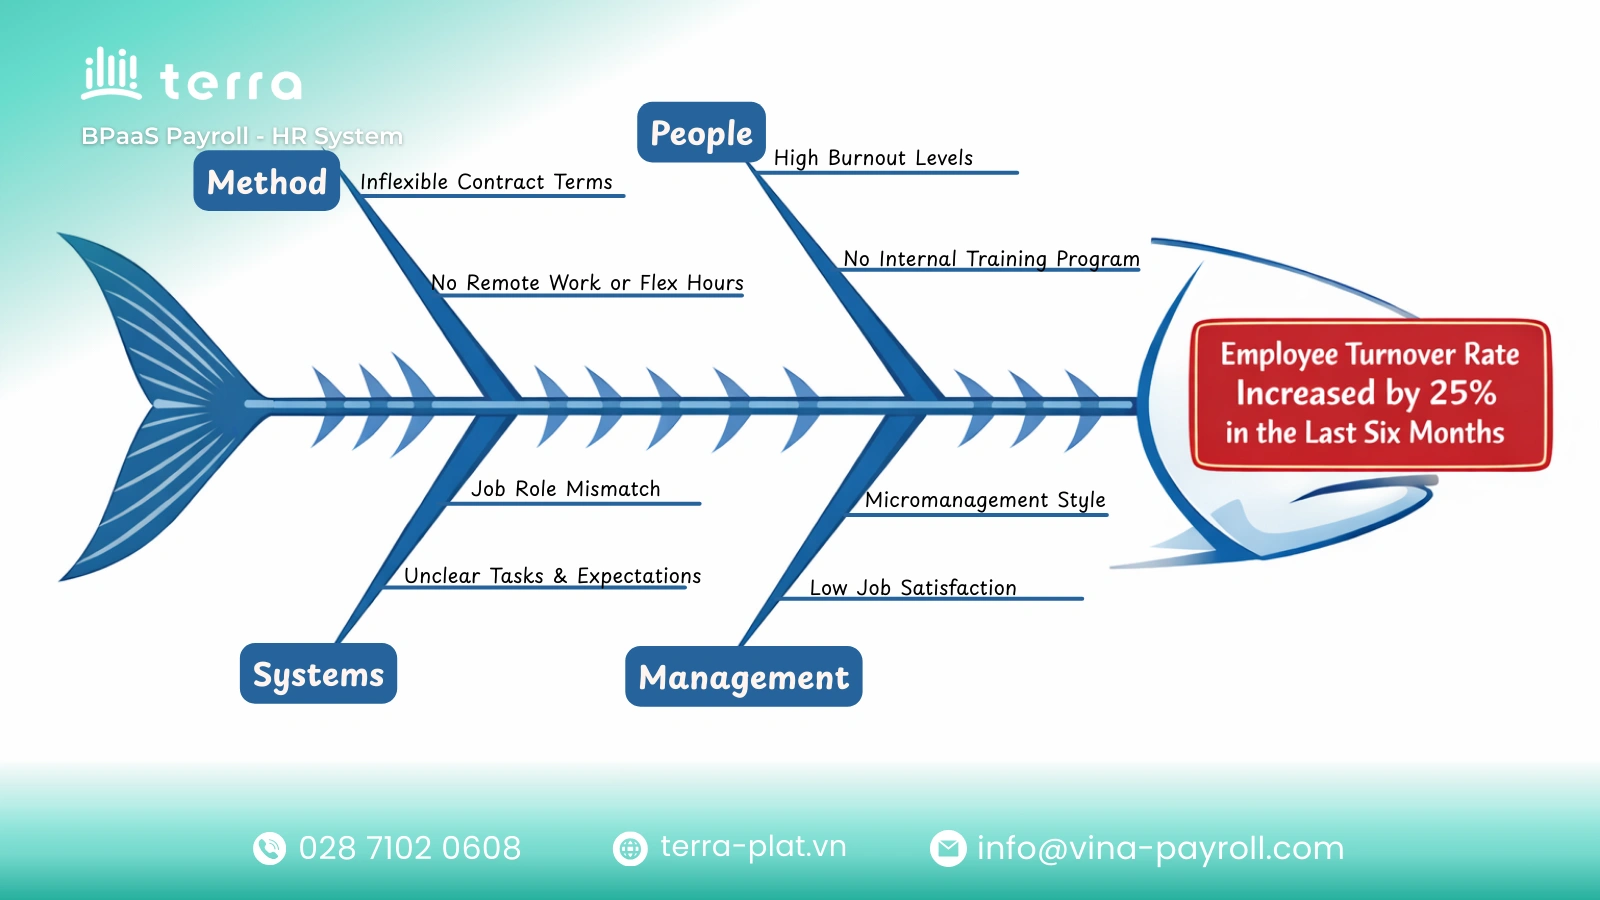
Problem Statement: “Employee turnover rate increased by 25% in the last six months.
In this scenario, a service-based company uses the diagram to investigate why their top talent is leaving.
- People (Manpower): High levels of burnout. Investigation reveals that employees feel their skills are stagnant because the company lacks a structured internal training program.
- Method (Process): Inflexible labor contract terms. The current contracts do not allow for remote work or flexible hours, which is a high priority for the modern workforce.
- Management: The prevailing Leadership Style is identified as “Micromanagement.” Team leads are not empowering their staff, which stifles innovation and leads to low job satisfaction.
- Systems: A disconnect between the employment contract and actual job duties. New hires find that their daily tasks are significantly different from what they signed up for, leading to early resignations.
Fishbone diagram example – Complex case
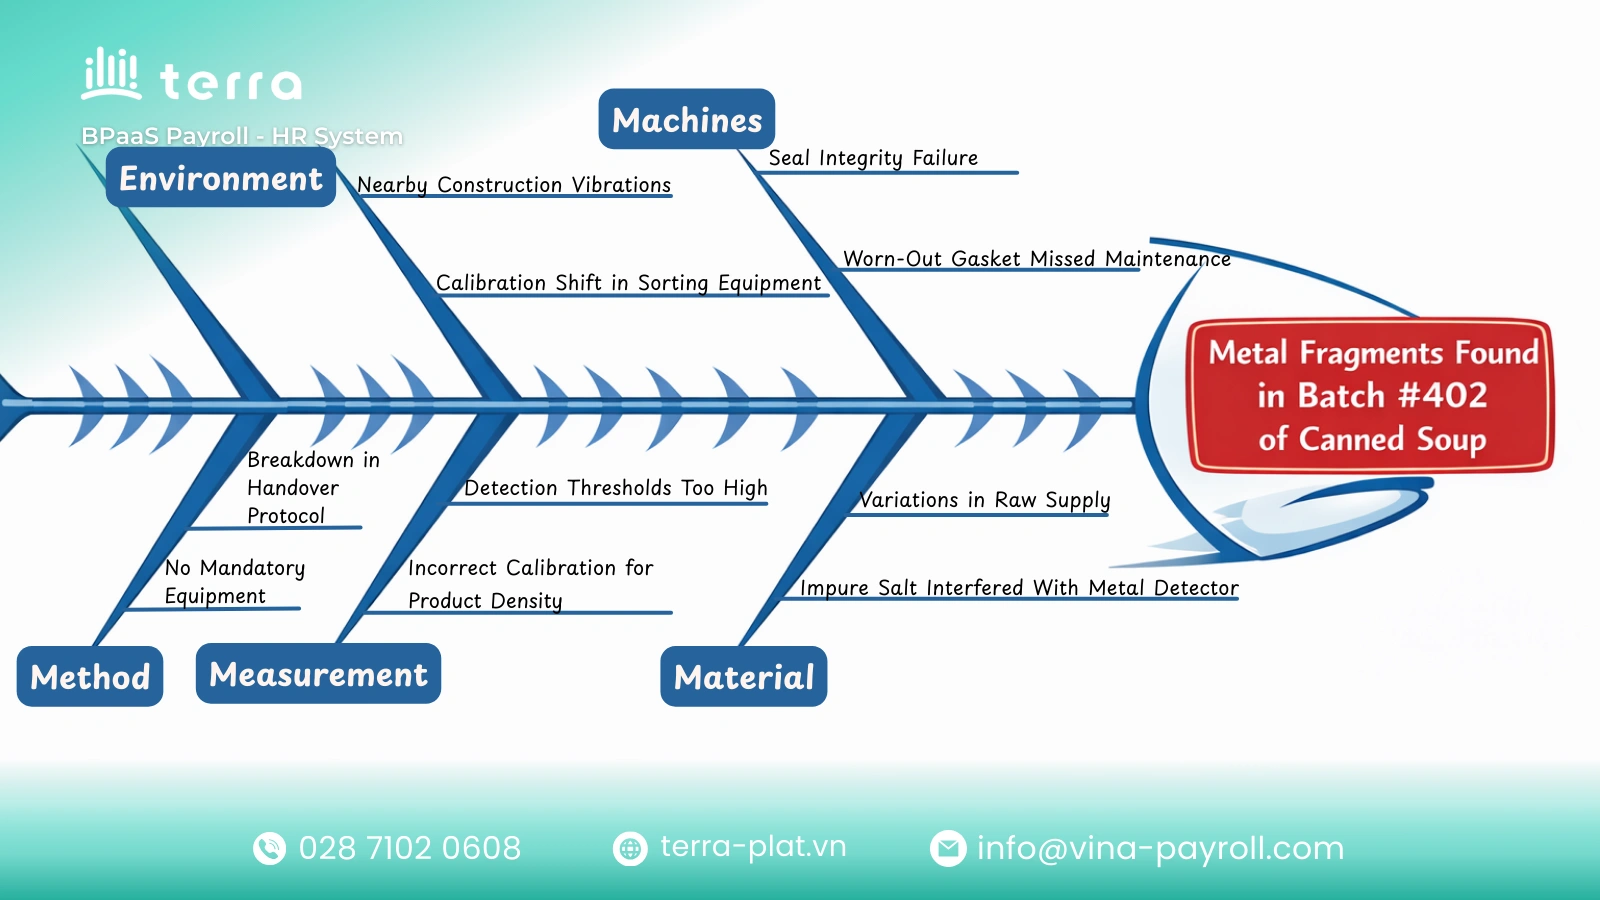
Problem Statement: “Metal fragments found in Batch #402 of canned soup.”
This requires a deep, multi-layered analysis using the 5M1E model to ensure consumer safety and prevent a costly recall.
- Machines: A failure in the seal integrity of the mixing unit. Upon closer inspection, the “sub-bone” cause is identified as a worn-out gasket that had bypassed its scheduled maintenance.
- Environment: Vibrations from a nearby construction project. These external vibrations caused a calibration shift in the precision sorting equipment, allowing contaminants to pass through.
- Material: Variations in raw supply. The investigation looks at the secondary supplier’s quality checks. It turns out a batch of salt contained trace minerals that interfered with the metal detector’s sensitivity.
- Measurement: Detection thresholds were set too high. The “sub-bone” here is that the testing equipment was calibrated for a different product density, leading to a “false negative” during the initial safety sweep.
- Method: A breakdown in the handover protocol. The labor contract for the night shift didn’t clearly mandate a physical equipment inspection during shift changes, allowing the machine fault to go unnoticed for eight hours.
Practical notes when using a fishbone diagram

When you are learning how to make a fishbone diagram, it is easy to focus only on physical tools and forget the “human foundation.” However, most organizational failures are rooted in how people are managed and governed.
- Employment contract clarity: Does the employment contract define the safety protocols and quality standards expected? If not, the “root cause” isn’t the person, but the documentation.
- Labor contract restrictions: Sometimes, a rigid labor contract prevents management from moving people to different stations where they might be more effective, creating a “Method” bottleneck.
- Leadership style assessment: If your diagram consistently points toward “People” issues across different departments, the root cause is likely a systemic Leadership Style that doesn’t prioritize clear communication or accountability.
terra HR system
While specialized recruitment software is excellent for talent acquisition, many businesses find greater value in a unified system. terra HR Management System is a comprehensive solution that integrates recruitment directly into the core HR workflow.
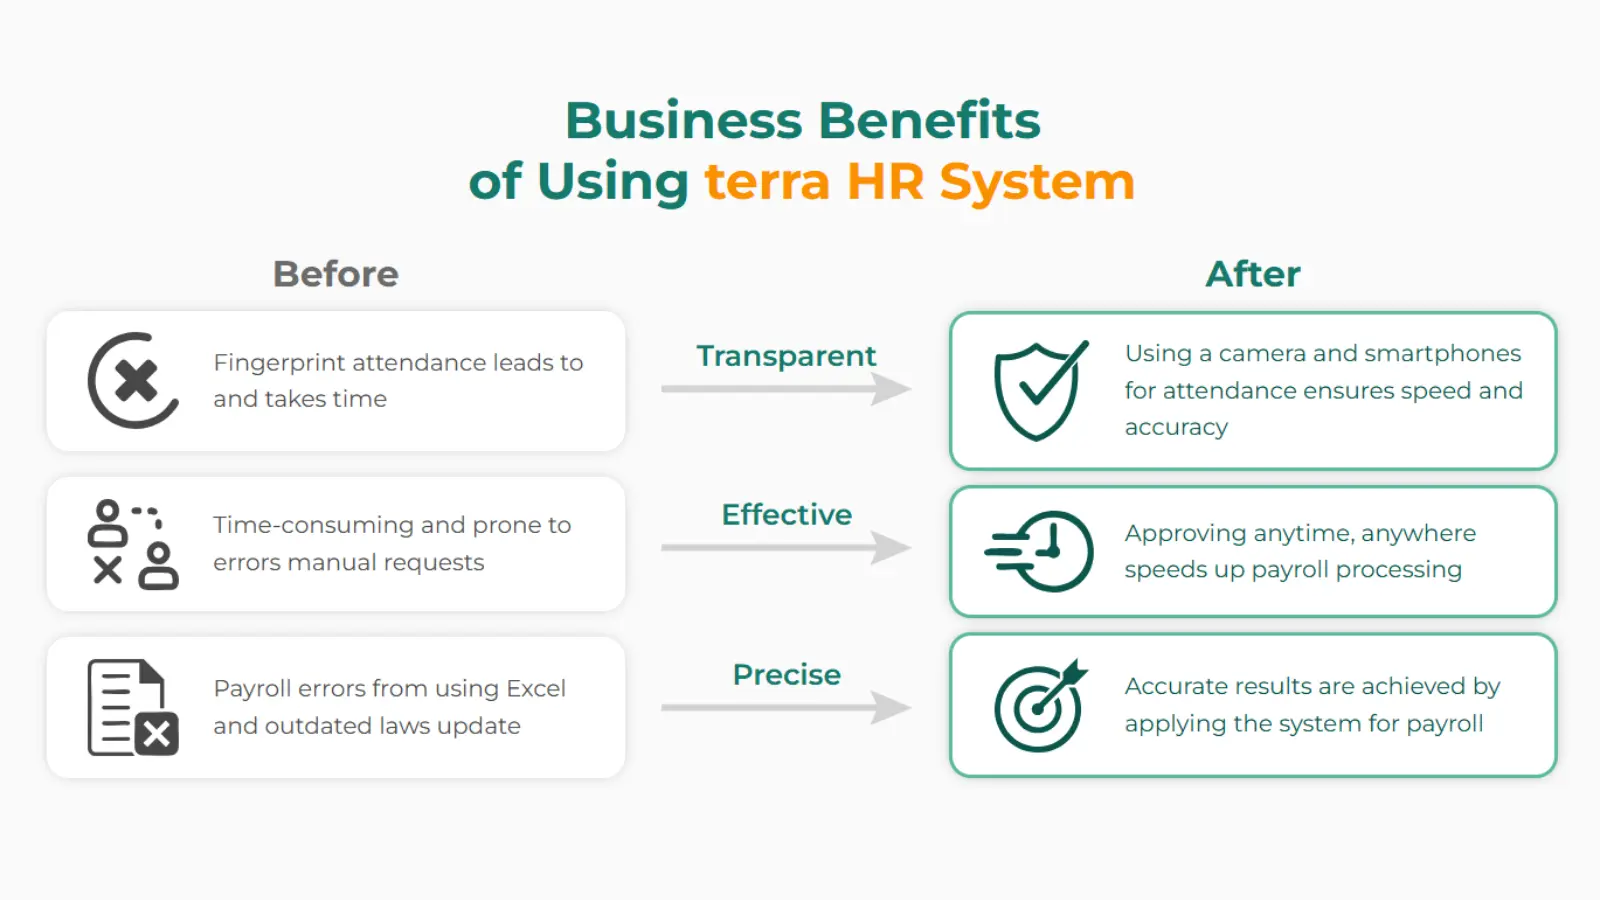
This all-in-one terra HR Solution provides a single hub for all employee data, so when you hire a candidate, their profile automatically transfers to payroll and management, eliminating errors and creating a seamless onboarding process.
- Core HR management: This is the central heart of the terra HR Platform. It securely stores and manages all employee profiles, contracts, and insurance details, eliminating paperwork and providing instant, centralized access to all critical records.
- Automated payroll management: This module automates complex calculations for salary, Personal Income Tax (PIT), and social insurance, ensuring 100% compliance with Vietnamese regulations. It links directly to timekeeping data to generate accurate, individual payslips for every employee.
- Time & attendance management: Effectively track working hours, overtime, and diverse leave policies. This feature integrates with time clocks and allows employees to request time off, giving managers a clear, real-time view of attendance data.
- Performance & goal management: Set, track, and evaluate employee performance against clear objectives. This tool supports regular reviews and helps you make informed, data-driven decisions on promotions, employee training, and contract renewals.
Conclusion
The fishbone diagram is more than just a template; it is a mindset of deep inquiry. Whether you are using a fishbone diagram example for manufacturing or marketing, the goal remains the same: find the root, fix the problem, and flourish.