Understanding the average salary in the world involves looking beyond simple numbers to see the economic forces, inflation rates, and productivity metrics that shape take-home pay across different borders. Explore the article below with terra!
Global wage landscape: What’s happening right now
The current global economic environment is characterized by a delicate recovery as markets strive to stabilize after years of unprecedented volatility. While nominal wages have seen increases, the real value of these earnings is heavily influenced by regional inflation and shifting labor demands.

Real wage growth is recovering but uneven across countries
According to recent global average wage statistics, real wage growth is beginning to show signs of life, yet it remains inconsistent. While some advanced economies are seeing wages finally outpace inflation, many developing nations are still struggling to bring real earnings back to the 2019 levels. This “K-shaped” recovery means that while some sectors thrive, others face stagnant purchasing power.
Income inequality is narrowing in some regions but gaps remain wide
While we observe a slight narrowing of the income gap in specific emerging markets due to aggressive minimum wage hikes, the overall average income worldwide still highlights a massive divide.
High-skilled workers in tech and finance continue to see their wealth grow, whereas the informal sector in lower-income countries remains vulnerable to economic shocks.
Average salary by country
When analyzing the average salary by country, it becomes clear that geography is one of the strongest determinants of earning potential. However, these figures are rarely about the “price” of labor alone; they are a reflection of a nation’s economic maturity, currency strength, and the localized cost of living.
- High-income hubs: In regions like Northern Europe (Luxembourg, Norway) and North America, the average income worldwide peaks because of high-value-added sectors. Here, high paying jobs in tech and specialized medicine are the norm, supported by high productivity and advanced infrastructure.
- Emerging growth engines: In contrast, the manufacturing and services hubs of Southeast Asia offer a different landscape. While nominal figures may appear lower, the rapid digital transformation in countries like Vietnam is driving a surge in competitive “market rates” for skilled talent that often exceeds traditional national averages.
Ultimately, the disparity in global wages is a balance between Purchasing Power Parity (PPP) and market demand. A high salary in a mature economy may offer the same “lifestyle quality” as a mid-range salary in a high-growth, lower-cost-of-living country.
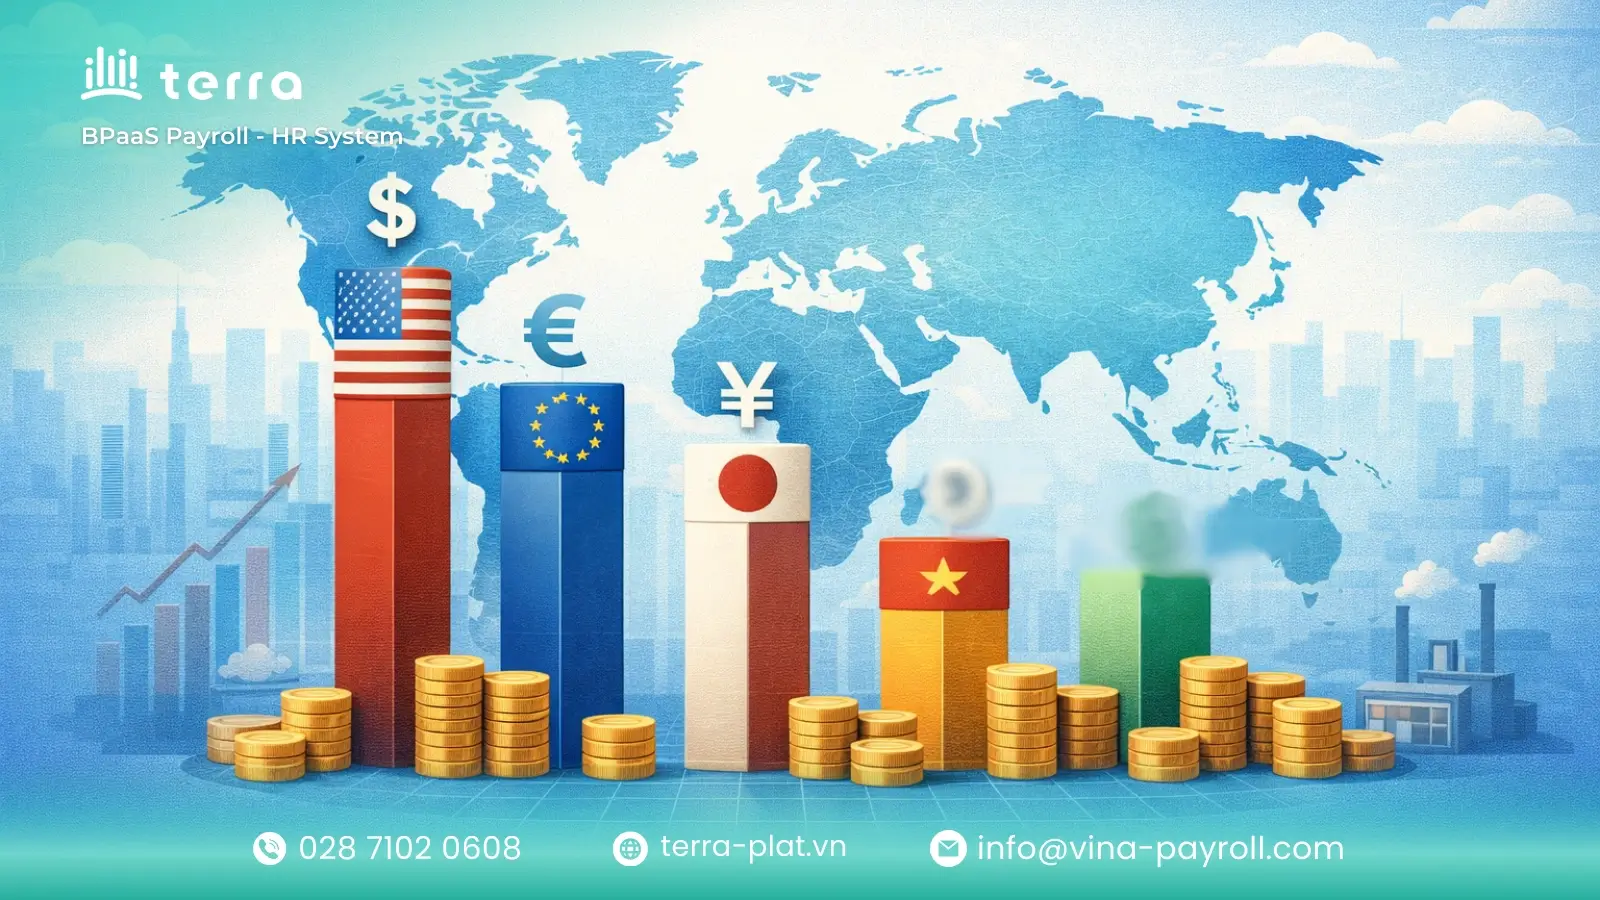
Global average salary comparison
| Country / Region | Avg. net monthly salary (USD) | Equivalent (VND) | Key high-value sectors |
| Switzerland | ~$8,200 | ~209,000,000 | Finance, Pharma, Luxury Manufacturing |
| Luxembourg | ~$6,700 | ~170,000,000 | Investment Banking, Global Logistics |
| United States | ~$6,500 | ~165,000,000 | Big Tech, Healthcare, Aerospace |
| Singapore | ~$4,500 | ~114,000,000 | Fintech, AI, International Trade |
| Japan | ~$2,600 | ~66,000,000 | Robotics, Automotive, Electronics |
| Vietnam | ~$450 – $550 | ~11,500,000 – 14,000,000 | IT, Hi-Tech Manufacturing, Export |
Salary trends by region and income level
To better understand the global pay scale, we must categorize nations not just by geography, but by their economic development status. This classification helps businesses understand the regulatory and financial environment they are entering.

High-income economies with high wages and complex compliance
In nations like Switzerland, the US, and Singapore, you will find the highest average salary in the world, but these come with stringent regulatory requirements. Employers in these regions must navigate complex tax codes, mandatory pension contributions, and high expectations for non-monetary benefits.
High-Income hubs – Salary vs. Compliance complexity
| Country | Avg. monthly gross (USD) | Est. monthly net (USD) | Primary compliance & tax obligations | Key non-monetary benefits |
| Switzerland | ~$7,800 | ~$6,400 | 3-Pillar Pension System (AHV/BVG), Cantonal & Federal Taxes | High-tier private health subsidies, professional development funds |
| United States | ~$6,200 | ~$4,700 | FICA Taxes (6.2% Social Security, 1.45% Medicare), Federal/State Income Tax | 401(k) employer matching, comprehensive Health Savings Accounts (HSA) |
| Singapore | ~$5,600 | ~$4,400 | CPF Contributions: Employer (17%), Employee (20%) – Capped at 8,000 SGD salary | 13th-month bonus (AWS), performance-based variable components |
Upper-middle-income countries with fast-growing salary markets
Countries in this bracket are currently the “growth engines” of the global economy, seeing rapid increases in high paying jobs within the industrial and service sectors. These markets are becoming increasingly competitive as local talent demands pay that reflects their rising productivity and specialized skills.
Upper-middle-income economies – salary growth & sector dynamics
| Country | Avg. monthly net salary (USD) | Est. annual salary growth (%) | Lead growth sectors | High-demand specialized skills |
| Vietnam | $500 – $650 | 7.5% – 8.5% | Semiconductor, AI, Fintech | VLSI Design, Data Engineering, Cyber Security |
| Malaysia | $1,100 – $1,400 | 5.0% – 6.0% | E&E Manufacturing, Digital Services | Cloud Architecture, Advanced Automation |
| Poland | $1,800 – $2,200 | 6.5% – 7.5% | IT Outsourcing, Green Energy | Full-stack Dev, Renewable Energy Engineering |
| Mexico | $900 – $1,200 | 5.5% – 6.5% | Automotive (EV), Nearshoring Tech | Robotics, Supply Chain Management |
| Thailand | $700 – $900 | 4.5% – 5.5% | Medical Tourism, E-commerce | Health-tech, Digital Marketing Strategy |
Lower-middle and low-income countries with informality and minimum wage sensitivity
Countries in this bracket are currently the “growth engines” of the global economy, seeing rapid increases in high paying jobs within the industrial and service sectors. These markets are becoming increasingly competitive as local talent demands pay that reflects their rising productivity and specialized skills.
Lower-middle & low-income markets – wage sensitivity & informality
| Country | Avg. monthly net salary (USD) | Informality rate (Est.) | Primary labor sectors | Sensitivity to min. wage |
| Vietnam | $350 – $500 | 55% – 60% | Garments, Electronics, Agri-processing | High (Directly impacts FDI costs) |
| India | $250 – $450 | 80% – 85% | Services, Textile, Construction | Very High (Varies significantly by state) |
| Bangladesh | $150 – $250 | 85% – 90% | Readymade Garments (RMG), Leather | Critical (Major driver of social stability) |
| Cambodia | $200 – $350 | ~90% | Footwear, Garments, Tourism | High (Standardized by industry) |
| Ethiopia | $80 – $150 | ~75% | Agriculture, Light Manufacturing | Moderate (Rising due to industrial parks) |
Why salaries differ across countries
It is often asked why a software engineer in San Francisco earns five times more than one in Ho Chi Minh City for similar work. The answer lies in a combination of macroeconomic factors and local market dynamics that dictate the “price” of labor.
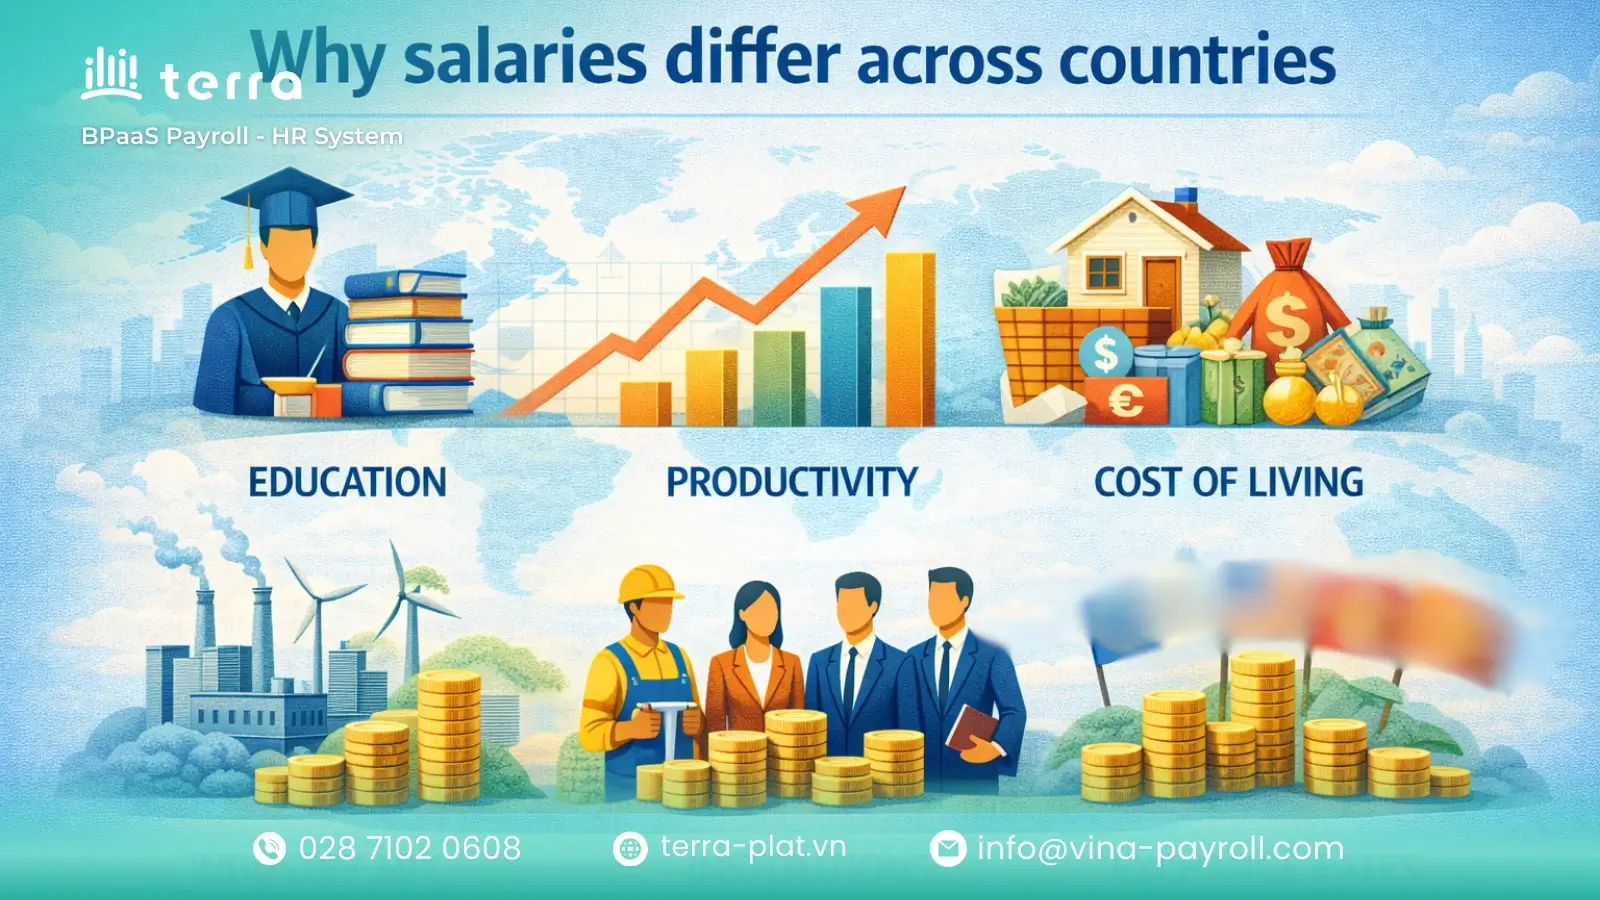
Industry structure including tech, finance, manufacturing, and services
The dominant industries in a country heavily influence its average pay. Countries that have successfully pivoted toward high-value services like FinTech or Biotech naturally report a higher average income worldwide compared to those reliant on traditional agriculture or low-end assembly.
Global average salary by industry & economic maturity
| Industry sector | High-income hubs (Avg. USD/month) | Emerging markets (Avg. USD/month) | Value type | Key roles driving pay |
| FinTech & Finance | $7,500 – $12,000 | $1,500 – $3,500 | High-Value Service | Blockchain Dev, Risk Analyst, Quant |
| Biotech & HealthTech | $8,000 – $11,000 | $1,200 – $3,000 | Specialized R&D | Biomedical Engineer, Clinical Researcher |
| Tech (AI & SaaS) | $7,000 – $13,000 | $1,800 – $4,500 | Scalable Tech | AI Architect, Cloud Engineer |
| Precision Mfg. | $5,000 – $7,500 | $900 – $1,800 | Specialized Industry | Robotics Technician, VLSI Engineer |
| General Services | $3,500 – $5,000 | $450 – $800 | Labor Intensive | Hospitality Manager, Retail Staff |
| Agri & Assembly | $2,500 – $3,500 | $300 – $550 | Low-end Production | Production Line Worker, Farmer |
Productivity, skills availability, and company size
Wage levels are intrinsically linked to labor productivity. When workers have access to advanced technology and high-quality training, their output value increases, justifying higher pay. Furthermore, large multinational corporations often set the pace for “market rates,” paying a premium for top-tier talent compared to local small businesses.
Impact of productivity & organization size on salary
| Driver category | Organization type | Skill proficiency | Avg. monthly salary (global hubs) | Avg. monthly salary (emerging – VN) |
| Multinational (MNC) | Tier 1 (Google, Samsung, etc.) | High / Expert | $8,500 – $15,000 | $3,500 – $7,000 |
| Large National Corp | Industry Leaders | Advanced | $5,000 – $8,000 | $1,500 – $3,000 |
| SMEs / Startups | Local Mid-size | Mid-level | $3,000 – $5,000 | $800 – $1,500 |
| Local Small Business | Family-owned / Micro | Entry / Basic | $2,000 – $3,500 | $450 – $750 |
Taxes, social insurance, and mandatory employee benefits
A high “gross salary” does not always mean high “net pay.” Differences in social security systems and personal income tax (PIT) mean that two countries with the same gross average salary by country can offer very different qualities of life for the employees after all deductions are made.
Vietnam’s salary levels in the global context
Vietnam has emerged as a critical player in the global supply chain, transitioning from a low-cost manufacturing hub to a diversified economy with a growing tech scene. Consequently, the average salary in Vietnam has seen steady upward pressure over the last few years.
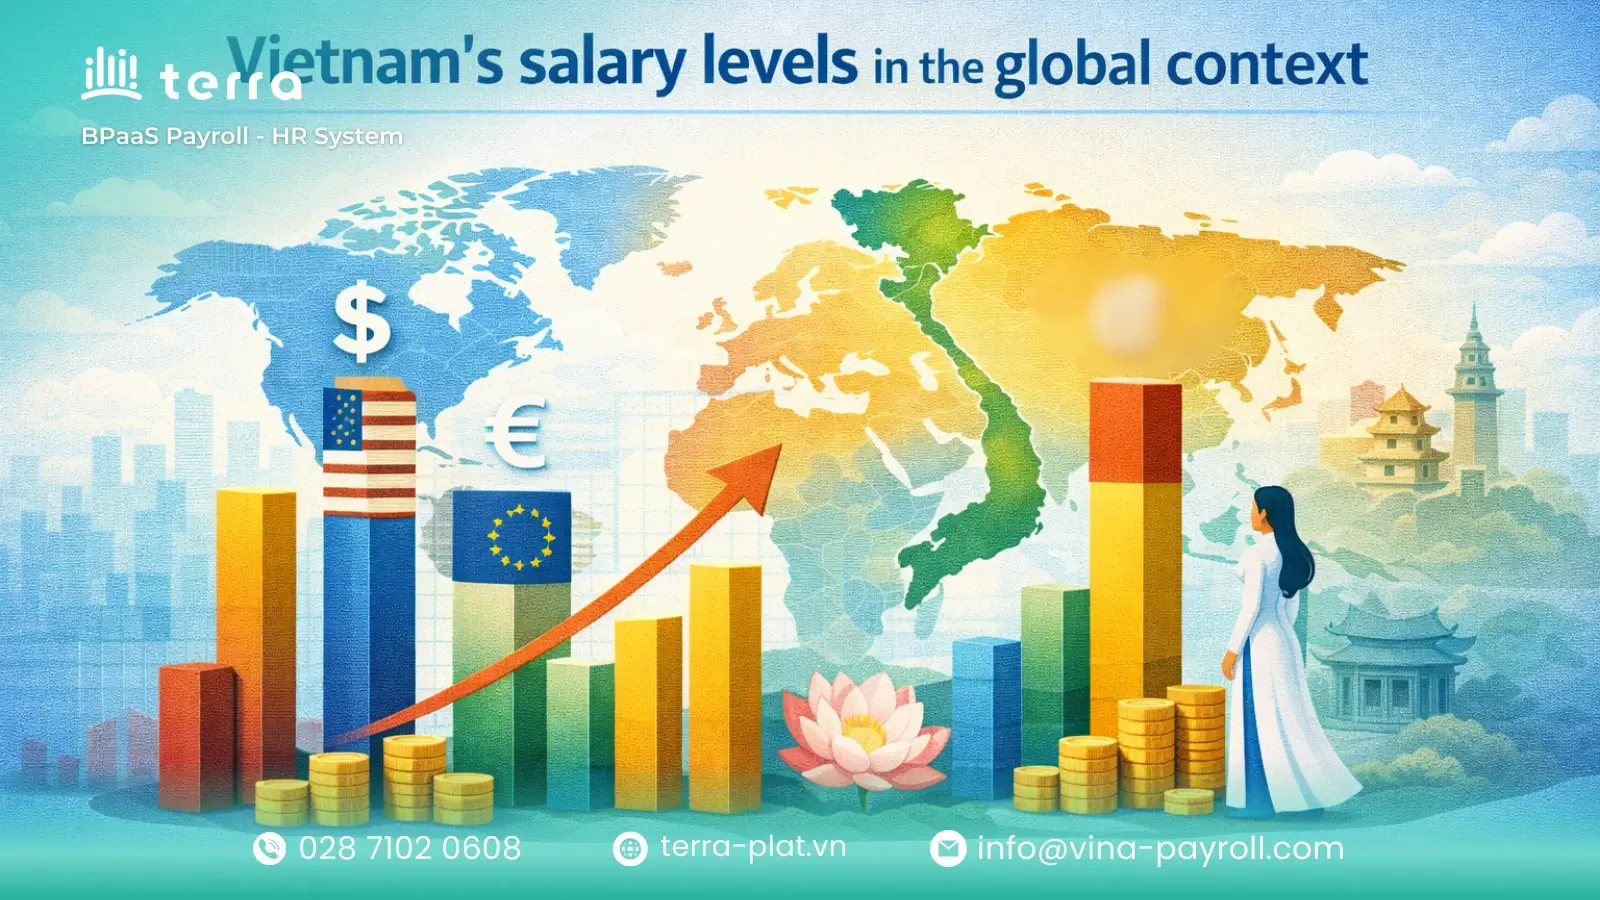
Vietnam compared with global and regional peer economies
When compared to regional peers like Thailand or the Philippines, Vietnam remains highly competitive. While it may no longer be the “cheapest” labor market, the high literacy rate and technical adaptability of the Vietnamese workforce provide a better “value-to-cost” ratio for foreign investors.
Minimum wage and market wage and why both matter
The Vietnam minimum wage serves as a vital social safety net and a baseline for calculating insurance contributions. However, for most professional roles, the actual market wage is significantly higher. Employers must monitor both to remain compliant with the law while remaining attractive to skilled professionals.
Vietnam salary landscape 2026 – minimum wage vs. market reality
| Category | Regulatory minimum (statutory) | Competitive market rate (professional) | Strategic significance |
| Monthly Salary | 5,310,000 VND (Region I) | 18,000,000 – 45,000,000+ VND | Minimum wage sets the insurance floor; Market rate secures talent |
| Overtime Base | Min. 150% of Basic Salary | Negotiated in Total Package | Legal compliance for factory shifts vs. tech flexibility |
| Social Insurance | Based on Contractual Wage | Often based on Gross Salary | MNCs use full-salary insurance as a premium benefit |
| Annual | Not mandatory (Optional) | 13th Month + Performance Bonus | Market standard for retention in Tier 1 & 2 cities |
| Primary Use Case | Blue-collar / Entry-level | White-collar / Specialized Tech | Balancing cost-efficiency with “Brain Drain” prevention |
What global salary benchmarks mean for employers
For modern HR leaders and business owners, the average salary in the world is more than just a macroeconomic statistic, it is a critical strategic compass for talent retention and financial planning. In an era where remote and hybrid work have decoupled “place” from “pay,” the traditional localized approach to compensation is no longer sufficient.
- The borderless talent war: Local companies are no longer just competing with the firm across the street. They are now in a direct “talent war” with global giants. These international players can leverage their headquarters’ capital to offer high paying jobs to local experts, effectively bringing “Western” salary standards into “Eastern” markets.
- Data-driven compensation models: Utilizing global average wage statistics allows employers to move away from guesswork. Strategic benchmarking helps HR teams build “tiered” pay structures that balance local cost-of-living adjustments with the global market value of a specific skill set (e.g., software engineering or data science).
- Balancing fairness and profitability: The goal of benchmarking is to find the “sweet spot”, offering a salary that is “fair” enough to prevent attrition to overseas competitors while remaining sustainable within the local economic context.
By grounding salary offers in objective global data, companies can build a “total rewards” strategy that is both transparent for the employee and cost-effective for the business.

Frequently asked questions (FAQs) about global salaries
Here are frequently asked questions (FAQs) about global salaries:
What is the average salary in the world?
While it varies by source, the global average is often difficult to pinpoint as a single number due to currency fluctuations. However, looking at global average wage statistics from the ILO, the figure is heavily skewed by high-income nations, making regional averages more useful for business planning.
Which countries have the highest average salaries?
Typically, Switzerland, Luxembourg, the United States, and Iceland consistently rank at the top. These nations combine high productivity with a high cost of living, leading to the highest gross earnings globally.
What is the difference between wage, salary, and income?
- Wage: Usually refers to hourly or weekly pay (often for manual or blue-collar work).
- Salary: A fixed regular payment, typically expressed as an annual sum.
- Income: The total money received, which can include salary plus investments or bonuses.
How taxes and social contributions affect net salary comparisons
In Vietnam, as of 2026, the family deduction has been adjusted to 15.5 million VND for the taxpayer and 6.2 million VND per dependent. Furthermore, the Law on Social Insurance 2024 (effective July 2025) now allows employees to qualify for a pension with only 15 years of contributions, enhancing the long-term value of the “net” compensation package.
How employers can benchmark salaries when hiring remote workers
Employers should use a “local-plus” pay scale. This involves taking the average salary by country where the employee lives and adjusting it slightly upward to account for the value they bring to a global firm.
terra Payroll – End-to-End BPaaS Payroll Services in Vietnam
terra Payroll Services

Salary management and calculation are complex tasks that require precision and compliance with legal standards. To simplify this process, many companies choose payroll outsourcing services.
terra Payroll Service in Vietnam offers:
- Accuracy & compliance: Always updated with the latest laws.
- Time & cost savings: No need to invest in payroll software or dedicated HR staff.
- Data security: Advanced protection of sensitive information.
- Expert support: A team ready to handle complex payroll issues.
- Customized payroll solutions: Flexible packages suitable for different business sizes.
By using outsourced payroll services, companies can focus on core business activities while ensuring employee satisfaction and legal compliance.
To learn more about payroll outsourcing services in Vietnam, visit terra official website or contact the hotline at +84 28 7102 0608 for tailored consultation.
Conclusion
The average salary in the world is a moving target, influenced by inflation, technological shifts, and regional policies. For businesses in Vietnam or those looking to enter the market, staying informed on these 2026 legal updates is the key to building a sustainable and motivated workforce.